top of page
This site was designed with the
.com
website builder. Create your website today.
Start Now
Map Projects
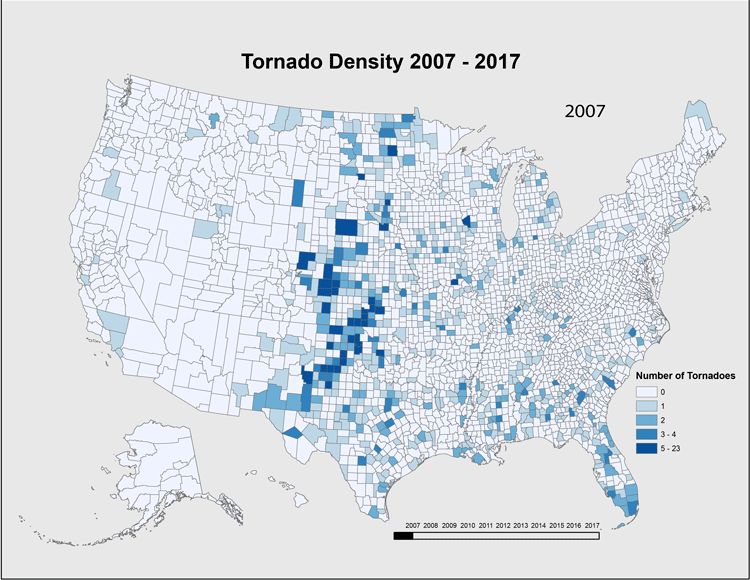
This map is a density map of tornadoes in every county in the U.S. from 2007 to 2017. For this map, I used ArcMap, Adobe Illustrator, and Adobe Photoshop.
Home
Glacier National Park
Earthquake Magnitude 1999-2009
MapBox Project
New Manufacturing Sites
Tornado Animation
Alaska
Kenai Penisula, Alaska
Fishing
Wisconsin Popultion Change
Hypsometric Tinting Mt. Hood
Hypsometric Tinting Volcanic Region
Going to the Sun Road Terrain Map
Mt. Rainier - Topographic Map
Wisconsin Population Density Change
bottom of page